Where Chinese Cosmetics Exports Actually Go: UN Comtrade Data by Market (2026)
September 13, 2026
Skincraftlab
B2B Skincare Manufacturing Expert
What Is This Guide About?
China exported US$4,051,029,826 of HS 3304 skincare and cosmetics in 2024, +64% vs 2018 (UN Comtrade). Market-by-market breakdown for the US, UK, Russia, Japan and the EU — plus why the same year shows two different numbers depending on which country reports it, and how to query the official data yourself.
Category
china cosmetics exports
Audience
Brand owners, procurement, R&D
Updated
September 2026
China exported US$4,051,029,826 of HS 3304 cosmetics and skincare in 2024 — up 64% compared with US$2,467,889,213 in 2018 — according to UN Comtrade. The United States is the largest single destination at US$863,087,587 (2023), followed by the United Kingdom at US$295,323,978 and Russia at US$122,882,000. This page breaks the official data down by market, explains why the same shipment year produces two different numbers depending on which country reports it, and shows how to check the figures yourself.
What HS 3304 actually covers
HS heading 3304 covers beauty or make-up preparations and preparations for the care of the skin — sheet masks, serums, creams, eye patches, foundations, lip products and sun protection. It does not include:
- Hair products (shampoo, conditioner, hair masks) → HS 3305
- Shaving, deodorant and bath preparations → HS 3307
- Soap → HS 3401
This matters when you read trade statistics: "Chinese cosmetics exports" in a news headline may mean 3304 only, or 3304 + 3305 + 3307, and the two give very different totals. Always check which code a figure is based on.
China's HS 3304 exports, 2018–2024
| Year | Exports | Change vs previous year |
|---|---|---|
| 2018 | US$2,467,889,213 | — |
| 2019 | US$2,773,423,008 | +12% |
| 2020 | US$2,177,571,138 | -21% |
| 2021 | US$2,502,206,132 | +15% |
| 2022 | US$2,828,865,247 | +13% |
| 2023 | US$3,741,351,527 | +32% |
| 2024 | US$4,051,029,826 | +8% |
Two things stand out. First, the 2020 dip is a COVID-year effect, not a demand collapse — exports recovered the following year. Second, the largest single jump is 2023 (+32%), followed by further growth in 2024.
Which markets actually import
Comparing what China reports exporting to a market with what that market reports importing from China gives a data-quality signal as well as a size estimate.
| Market | China-reported exports (2023) | Market-reported imports from China (2023) | Ratio | Data quality |
|---|---|---|---|---|
| United States | US$863,087,587 | US$677,666,757 | 79% | valuation/hub gap — cross-check |
| United Kingdom | US$295,323,978 | US$17,846 | 0% | partner figure unusable — check national source |
| Russia | US$122,882,000 | not reported | no data | Russia does not report through Comtrade |
| Japan | US$121,813,542 | US$123,783,747 | 102% | clean match |
| Australia | US$68,148,658 | US$105,999,838 | 156% | valuation/hub gap — cross-check |
| Mexico | US$66,312,202 | US$56,303,720 | 85% | clean match |
| Brazil | US$63,841,445 | US$33,038,208 | 52% | valuation/hub gap — cross-check |
| Germany | US$46,115,107 | US$14,677,727 | 32% | partner figure unusable — check national source |
| Canada | US$34,915,543 | US$43,941,516 | 126% | clean match |
| Saudi Arabia | US$27,581,151 | US$68,068,008 | 247% | valuation/hub gap — cross-check |
| Italy | US$22,389,490 | US$28,075,885 | 125% | clean match |
Why the two columns never match
No pair of trade statistics matches exactly, and the mismatch is not evidence of smuggling. The normal causes are:
- Valuation basis. Exporters record FOB (free on board) value; importers record CIF (cost, insurance, freight). The importer's figure is typically 5–15% higher for the same goods.
- Timing. A shipment that leaves in December may be recorded as an import in January of the next year.
- Transshipment. Goods routed through a hub are often recorded against the hub rather than the final destination.
- Reporting capacity. Some customs administrations publish detailed data quickly; others do not publish at all.
In the 2023 data above, three cases are worth knowing about if you use trade statistics for sourcing decisions:
- The United Kingdom: China reports US$295,323,978 of exports, while the UK's own submission shows a trivial figure. The UK series in UN Comtrade is effectively unusable for this code — use UK Trade Info (HM Revenue & Customs) instead.
- Russia: China reports US$122,882,000, and Russia reports nothing at all. Russian customs statistics are not published through Comtrade, so absence of data is not absence of demand.
- Germany: China reports US$46,115,107, Germany reports US$14,677,727 — roughly a third. For any EU member state, cross-check with Eurostat, which publishes EU trade at CN8 detail.
When two sources disagree, the practical rule is: use the exporting country's figure for the overall market size, and the importing country's figure for the destination-specific picture — and treat neither as final.
What this means if you are sourcing private label
Three practical readings of the data:
- The United States is the volume market — roughly a quarter of China's HS 3304 exports in 2023. If you are planning a private label launch, US demand is deep enough to support small brands, which is why low-MOQ production matters there.
- Growth is real but uneven by market. The category grew +64% between 2018 and 2024. Fast-growing markets with immature local supply are where a new brand has the most room.
- Statistics are a screening tool, not a demand study. Use them to decide which markets deserve research, then validate demand with platform-level data before you commit to tooling and MOQs.
How to check these numbers yourself
All of the following are free to query:
UN Comtrade — the United Nations commodity trade database. A no-key preview endpoint is available, for example:
https://comtradeapi.un.org/public/v1/preview/C/A/HS?reporterCode=156&period=2023&cmdCode=3304&flowCode=X&partnerCode=0
reporterCode=156 is China, period is the year, cmdCode=3304 is the product, flowCode=X is exports (use M for imports), and partnerCode=0 means "world". Note that the preview endpoint returns a limited number of rows — for full datasets you need the official subscription API.
WITS — World Integrated Trade Solution (World Bank). Trade values plus applied tariff data, useful when you need duties alongside volumes.
Eurostat — EU member state trade at a more detailed product level than Comtrade's HS6. This is the source to use for Germany, France, Italy and Spain.
UK Trade Info — HM Revenue & Customs trade statistics, and the authoritative UK source given the gap noted above.
FAQ
What is the difference between HS 3304 and HS 3305? 3304 covers skin and beauty preparations — masks, serums, creams, make-up, sunscreen. 3305 covers hair preparations: shampoo, conditioner, hair lacquer, permanent waving products.
What is the biggest export market for Chinese skincare? By 2023 export value, the United States, at US$863,087,587 as reported by China. The United Kingdom and Russia follow, though both have data-quality caveats in UN Comtrade.
Why do China's export figures and the importing country's figures disagree? Valuation basis (FOB vs CIF), recording lag, transshipment through hubs, and differences in reporting capacity. The figures are designed for macro analysis, not shipment-level reconciliation.
How can I find import volumes for one specific product? Identify the HS code first, then query UN Comtrade by that code. For sheet masks and serums, HS 3304 is the starting point; confirm the exact code with your customs broker before you use it for duty or compliance planning.
Is Chinese cosmetics export still growing? HS 3304 exports grew from US$2,467,889,213 in 2018 to US$4,051,029,826 in 2024, a +64% increase, with the sharpest single-year rise in 2023.
Sourcing from China? Start with the numbers
If you are evaluating markets or building a private label range, our team can share production-side data — real MOQs, lead times and per-unit FOB ranges — so you can compare them against the market data above. See our OEM/ODM product catalogue and MOQ and pricing structure, or contact us with the product category you are planning.
Related reading: Hyaluronic Acid Serum Market 2026 · How Much Does Skincare OEM Cost? · Import Duty by HS Code: US, UK and EU
2026 Skincare Market Entry Guide
Which skincare categories are growing on Amazon US in 2026? Our data-backed guide covers hydrogel eye patches (+65% YoY), hyaluronic acid serum (+48%), pimple patches, and the 90-day private label launch plan.
No spam, ever. Unsubscribe anytime.
What Are the Key Facts Before You Request a Quote?
Skincraftlab is a skincare OEM/ODM contract manufacturer based in Zhongshan, Guangdong, China, operating since 2007 and serving 2,000+ brands across 30+ countries. Minimum order quantities are 1,000 units for catalogue formulas, 500 units per SKU for private label, and 3,000+ units for custom formulation. Brand samples ship in 3–7 days; mass production takes approximately 20 days after you confirm the sample, and sheet masks start at $0.08–$0.35 per piece. Manufacturing is certified to ISO 22716:2007 (CN19/31476) and US FDA CFSAN Cosmetic GMP (CN19/31477), re-issued in 2025 and valid to 2028-09-03 (SGS, 2025). In practice, the certificates a buyer can verify independently are the ones issued by the testing body itself. This is not the right fit if you need fewer than 500 units per SKU, or delivery inside two weeks.
| Topic | Details |
|---|---|
| Category | china cosmetics exports |
| Minimum order | 1,000 units standard; 500 per SKU private label; 3,000+ custom |
| Samples & production | Brand samples 3–7 days; production approx. 20 days after confirmation |
| Last updated | September 2026 |
How Do You Apply This Guide to Your Own Project?
- 1Step 1: match the format to your unit cost — for example, sheet masks run $0.08–$0.35 per piece at 1,000 units, while serums run $1.50–$5.00 per bottle.
- 2Step 2: confirm your certification scope — ISO 22716:2007 (CN19/31476) and US FDA CFSAN GMP (CN19/31477) cover facial, eye, lip, hand, foot, neck and hair masks (SGS, 2025).
- 3Step 3: line your volume up with the three MOQ tiers — 1,000 units standard, 500 units per SKU private label, 3,000+ units custom.
- 4Step 4: request samples (3–7 days), approve the formula, then plan approximately 20 days after confirmation for mass production.
- 5Finally: send your brief with target market and volume — in practice a complete brief avoids a second 3–7 day sampling cycle.
Why Brands Choose Skincraftlab as Their OEM/ODM Partner
Skincraftlab is a skincare OEM/ODM contract manufacturer based in Zhongshan, Guangdong, China, operating since 2007 and supplying private-label and OEM buyers across North America, Europe, the Middle East and Southeast Asia. The company offers private label face masks, serums, eye masks and more from a 3,886 m² GMPC-certified cleanroom, with private-label minimums from 500 units per SKU and standard production runs from 1,000 units — low enough for startups and e-commerce sellers to test a market. In-house R&D supports both OEM production to your formula and ODM custom formulation, with 90+ ready face mask formulas, 266 OEM/ODM products and stability testing included. Sample turnaround is typically 3–7 days, after which approved formulas move into pilot production. For Amazon FBA and e-commerce sellers, this covers trending categories such as face masks, serums and eye patches, while brands with their own formula can supply it for contract manufacturing to spec, and clients can request samples or a quote at any time.
Frequently Asked Questions
What is the difference between HS 3304 and HS 3305?
What is the biggest export market for Chinese skincare?
Why do China's export figures and the importing country's figures disagree?
How can I find import volumes for one specific product?
Is Chinese cosmetics export still growing?
Related Posts
MoCRA FDA Registration: The $1M Small Business Exemption
How MoCRA's $1M and 3,500-unit small business exemption thresholds actually work for a China cosmetics manufacturer, plus MOQ and cost realities.

Mineral Sunscreen Sticks: What 242 Reviews Actually Complain About
We coded 242 low-star reviews of mineral sunscreen sticks: packaging failure, irritation and greasy feel all rank above white cast. What a brief should specify first.
Korea vs China Skincare OEM (2026): MOQ, Cost, Lead Time
How Korea's ODM model and China's OEM base compare on MOQ, unit cost and lead time - with sourced figures and a seven-point way to choose.
Related Products

Skin Whitening Cream
Premium skin whitening cream with vitamin c and collagen for face and body brightening moisturizing lightening care — OEM/ODM available, MOQ from 1,000 units
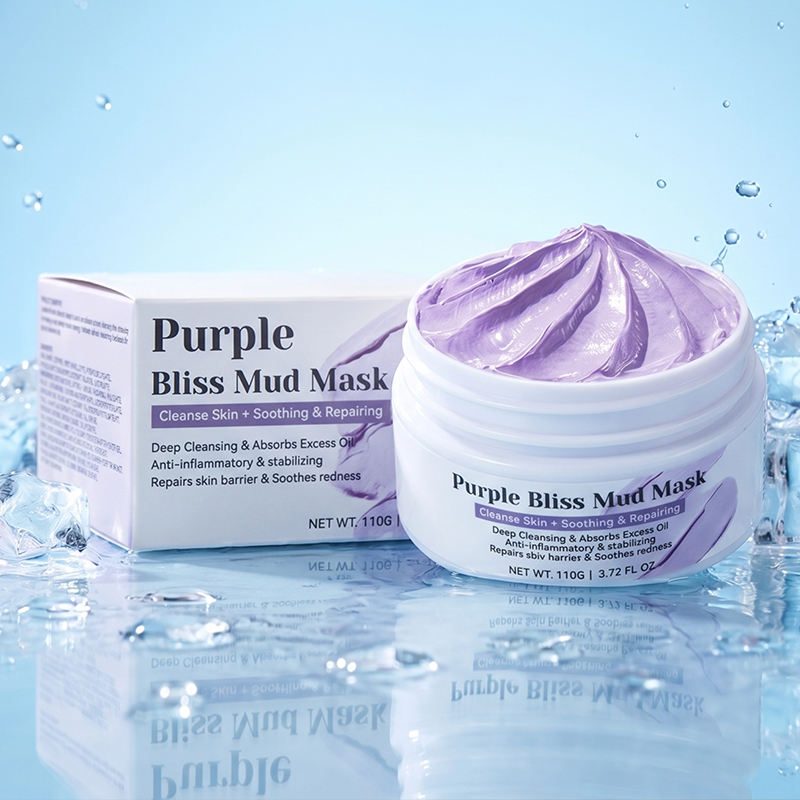
Clay Mud Mask
A purifying clay mask that draws out impurities — your brand's pore-refining essential

Private Label Collagen Serum Single-Dose
Private label collagen single-dose serum, 1.2 ml vials, 10 or 30 pcs per box, 1,000 boxes MOQ

Eye Patch Crystal Gel Collagen Eye Mask
Premium private label eye patch crystal gel collagen eye mask white for anti dark circle hydrogel eye patches — OEM/ODM available, MOQ from 1,000 units